
E-commerce · Retail
Turning category pages into revenue
Thin product pages and a slow theme capped organic growth until we rebuilt the collection architecture.
- Organic revenue
- 5.2x
- Product rankings
- +190%
Reporting dashboards bring your marketing numbers together in one simple view that shows what is working. We fix tracking, connect your data sources and build around the decisions you need to make.
Share a few details and we'll show you where growth is hiding.
Connecting the analytics and testing tools growing teams rely on
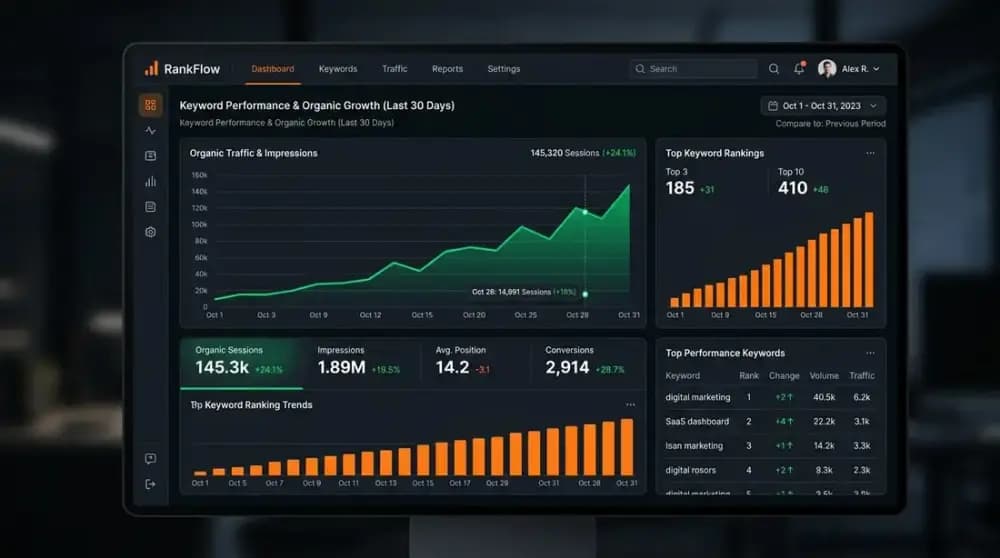
A dashboard is only as good as the data under it, and the questions it answers. So we start by asking what you would do differently depending on the numbers, then build only what supports those decisions.
Many dashboards get opened once and then forgotten, because they answer no one’s question. A simple page tied to real decisions is the one that gets used.
Reporting Dashboards often works best alongside these services. Each page explains what is included and when it makes sense for your business.
A CRO audit shows where visitors leave your site and why they did not take the next step.
Learn moreA/B testing compares two versions of a page with real visitors to learn which one works better for your business.
Learn moreTechnical SEO fixes the problems that stop search engines from crawling, rendering and indexing your pages.
Learn moreLocal SEO helps nearby customers find you on Google Maps and in “near me” searches when they are ready to call or visit.
Learn moreE-commerce SEO helps shoppers find your categories and products without paying for every click.
Learn moreEnterprise SEO is search work for sites where scale, approvals and legacy systems make simple changes hard.
Learn moreIf nobody trusts your marketing numbers, begin with a tracking check. It often reveals why reports disagree.
Buyers in each of these industries search differently. Your Reporting Dashboards plan reflects how they decide, what your sector requires and where competitors leave gaps.
Reach owners looking for tax, audit and advisory help in the areas you serve.
Show up for commercial and residential project searches in your region.
Grow category and product sales with pages built for how people shop.
Careful, accurate marketing that helps patients find and choose your care.
Clear practice-area content for people researching a legal problem.
Content and campaigns that bring qualified teams to a demo or trial.
Win calls from maps and local searches in every neighborhood you cover.
Earn more direct bookings from search, social and trip planning.
We build with the people who will use the report, so it reflects how your team actually works rather than how a template happens to look.
We talk to whoever will use the dashboard and list the questions it needs to answer, along with the actions that follow.
Start with discoveryGA4, tags, ad platforms and CRM data are checked, compared with one another, and repaired where they do not line up.
Sources are connected and naming is standardized, so that the same campaign is not reported under three different names.
A first version is built in Looker Studio or your preferred tool, then refined based on how your team uses it.
We document the definitions, train your team and hand over full ownership, so reports do not depend on us alone.
Walk through your goals with our team and leave with a clear 90-day Reporting Dashboards plan.
Business owners work with GENRANQ on Reporting Dashboards because the plan is clear, the reasoning is shown and the reporting is about leads and revenue.
Before any insight, we reconcile your analytics with actual sales or leads, so decisions do not rest on broken tracking.
Ideas come from your visitors’ behavior and feedback, which gives each test a reason beyond someone’s personal taste.
We set the sample and duration up front, and we will tell you when your traffic is too low for a reliable A/B test.
Dashboards are built around the decisions you need to make, with definitions anyone on the team can understand.
We connect ads, organic traffic, forms and your CRM where possible, so you can see what actually becomes revenue.
Every test and finding goes into a log you own, so what you learn stays with your business, whoever runs the next test.
Examples of what structured search and content work can look like in different industries.
Thin product pages and a slow theme capped organic growth until we rebuilt the collection architecture.
Strong reviews but invisible on Maps — rebuilt location pages now rank first in three suburbs.
Answer-first service pages and consistent entity data got the brand named in AI recommendations.
Senior-written practice-area guides overtook competitors on every pre-hire research query.
Feedback from the people we work with.
“Extremely reliable and super friendly staff. The team helped us with our digital strategy. Would recommend to everyone who wants to get their SEO done properly.”
“The GENRANQ team have been incredible to work with. From the very beginning they crafted a clear SEO strategy and have delivered measurable results month after month.”
“Our organic traffic grew by 280% in the first 90 days. The AI SEO approach is genuinely different — we're now appearing in ChatGPT and Google AI Overviews too.”
Still unsure? Talk to a strategist.
It is a single view of your important marketing numbers, usually updated automatically from sources such as GA4, ad platforms and your CRM. A good one helps you decide what to do next.
That depends on your goals. Most small businesses need spend, leads or sales, cost per lead or return, and conversion rate by channel. We trim the rest unless it supports a real decision.
They use different attribution rules, time windows and data sources. Consent settings and ad blockers also play a part. We explain each difference, then agree on which number you use for which decision.
Looker Studio is common because it is free and connects easily with Google products. We can also work with Power BI, Tableau or your CRM’s own reporting if your team already uses them.
Standard GA4 retains detailed event data for up to 14 months at most, and the default setting is shorter. Exporting to BigQuery is a sensible step if you need a longer history.
Often, yes, depending on the CRM. HubSpot, Salesforce and similar tools can usually send data on leads and closed deals, which lets you see which marketing brings in real revenue.
Yes. Dashboards and accounts stay under your business’s ownership, and your team gets the documentation needed to keep using them, whether or not you continue working with us.
Refresh times vary by source. Some data appears within minutes, while other data can take a day or more. We note the refresh timing on the dashboard, so nobody misreads an incomplete day.